How to add charts to a custom page
Configuration Steps
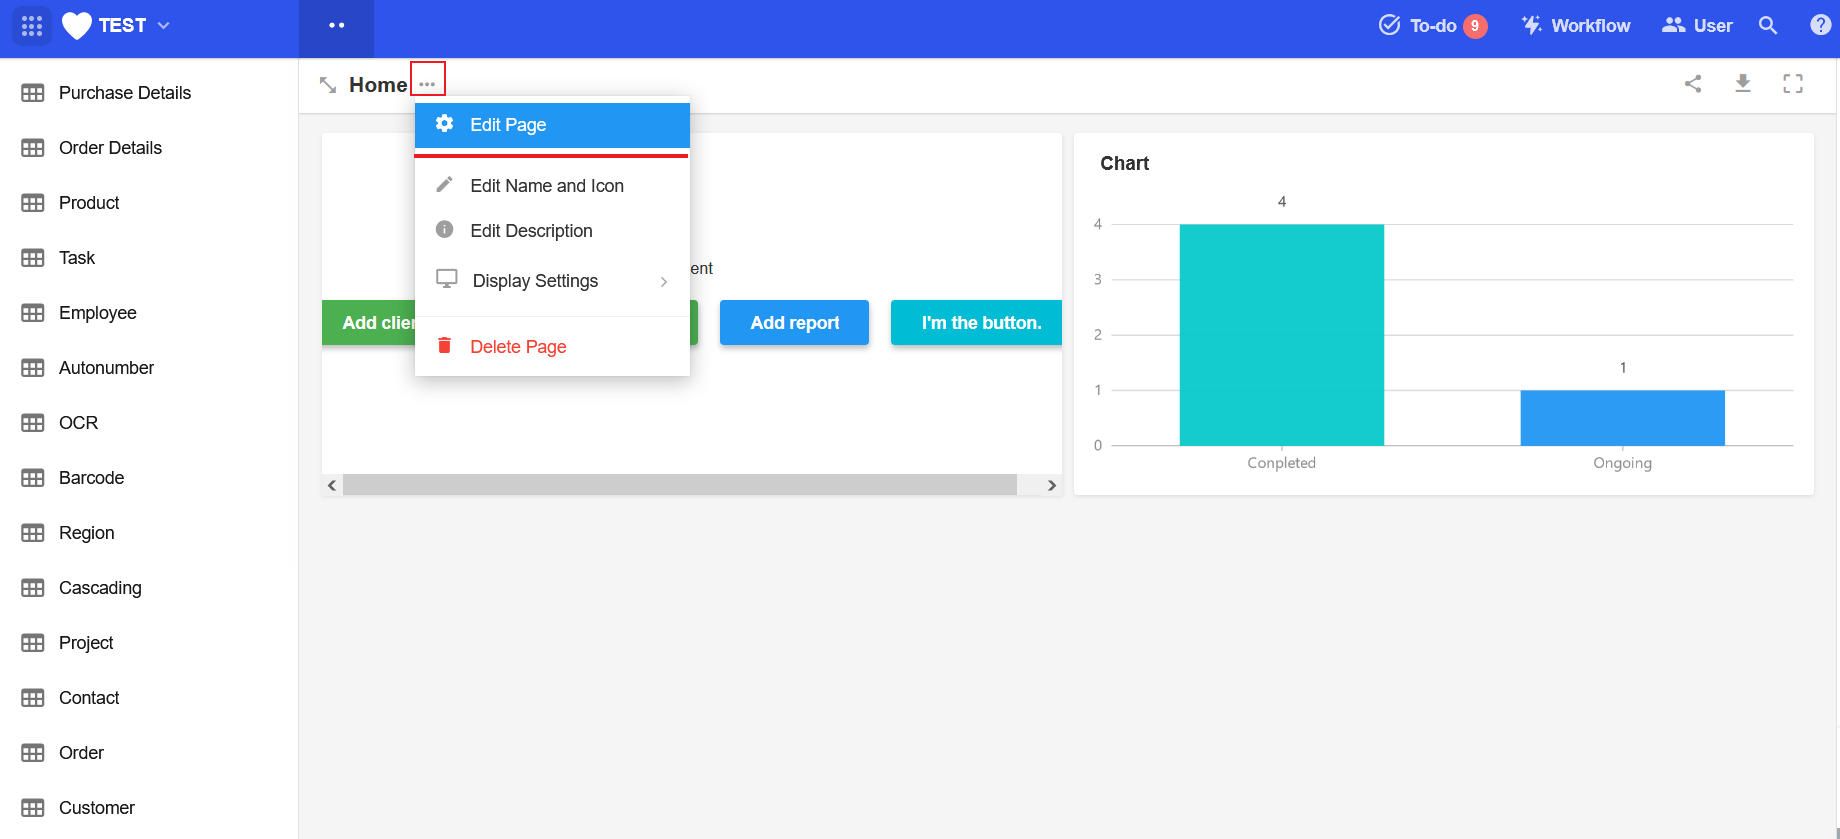
1. Enter the editing page of a custom page
2. Add a chart
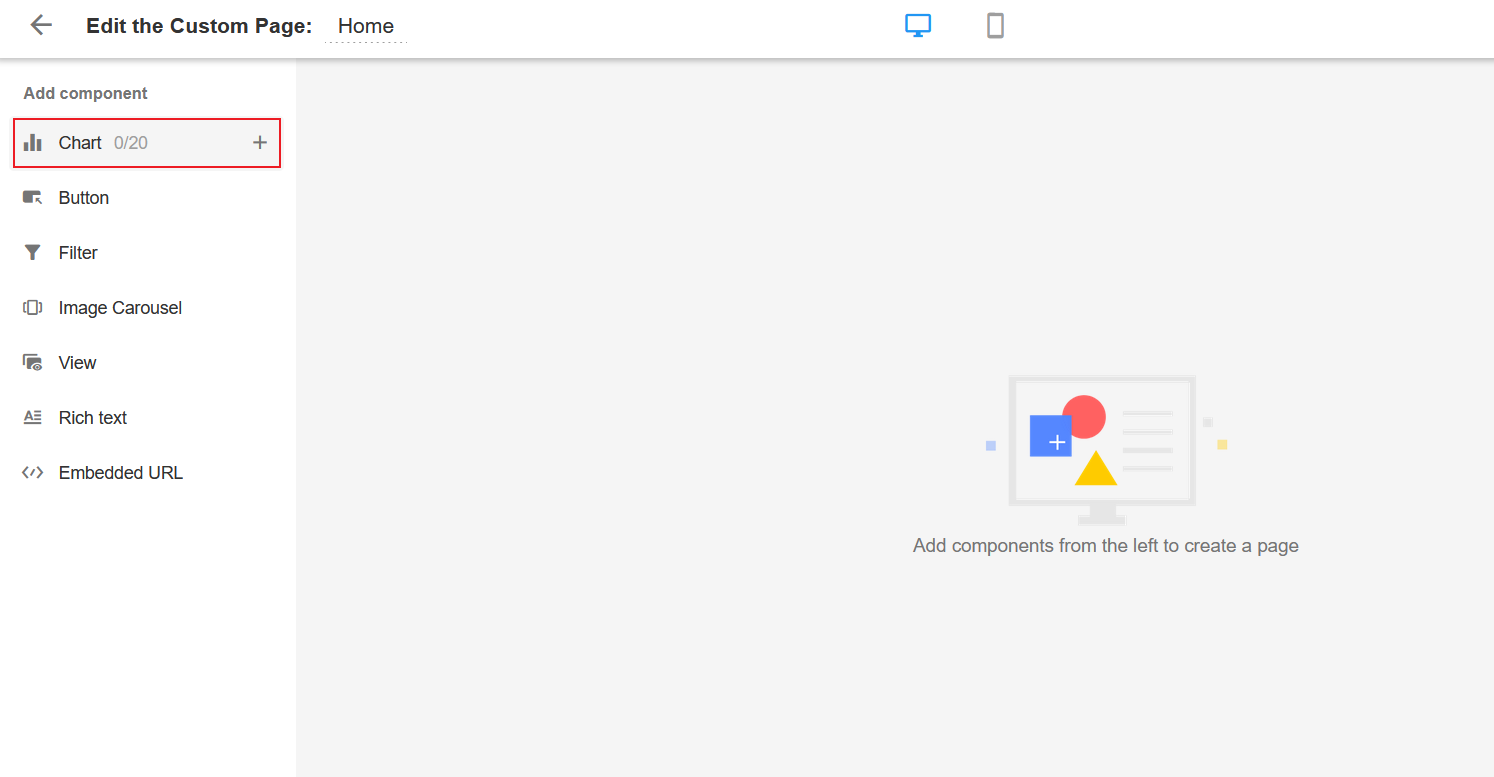
Currently you can add up to 20 charts to a custom page.
3. Select target worksheet and chart type
For example: To count the percentage of sales leads at different stages.
Select the worksheet [Sales Leads] and pie chart.
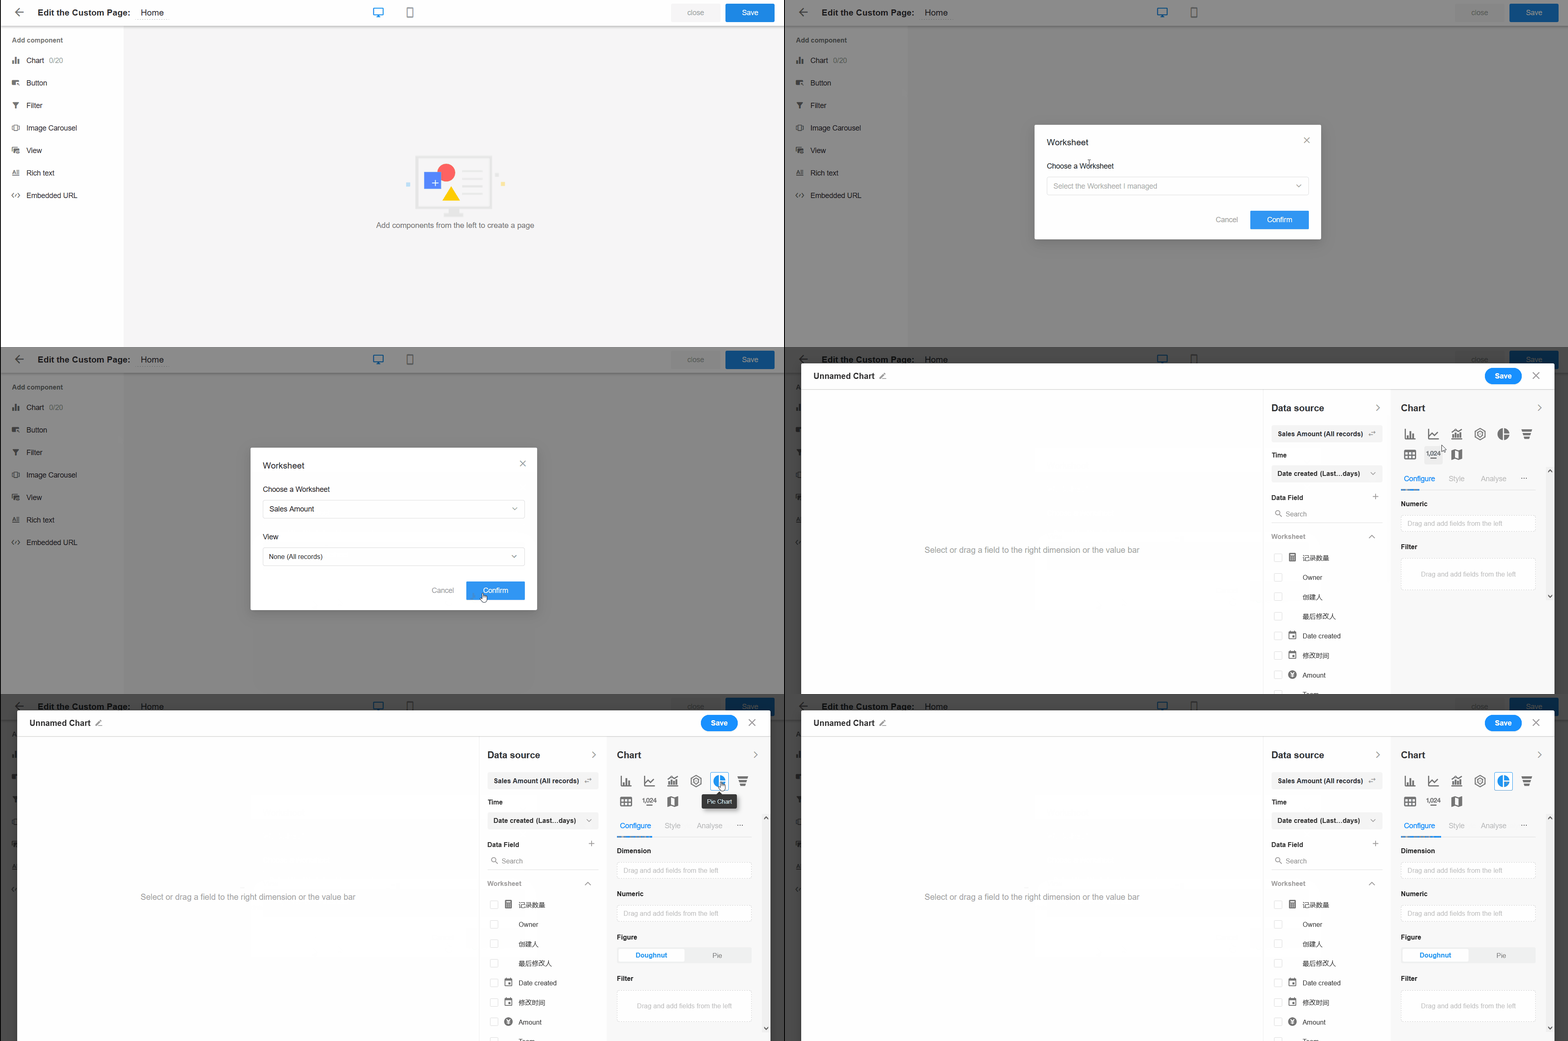
4. Set the chart
Detailed configuration of charts
5. Save the settings
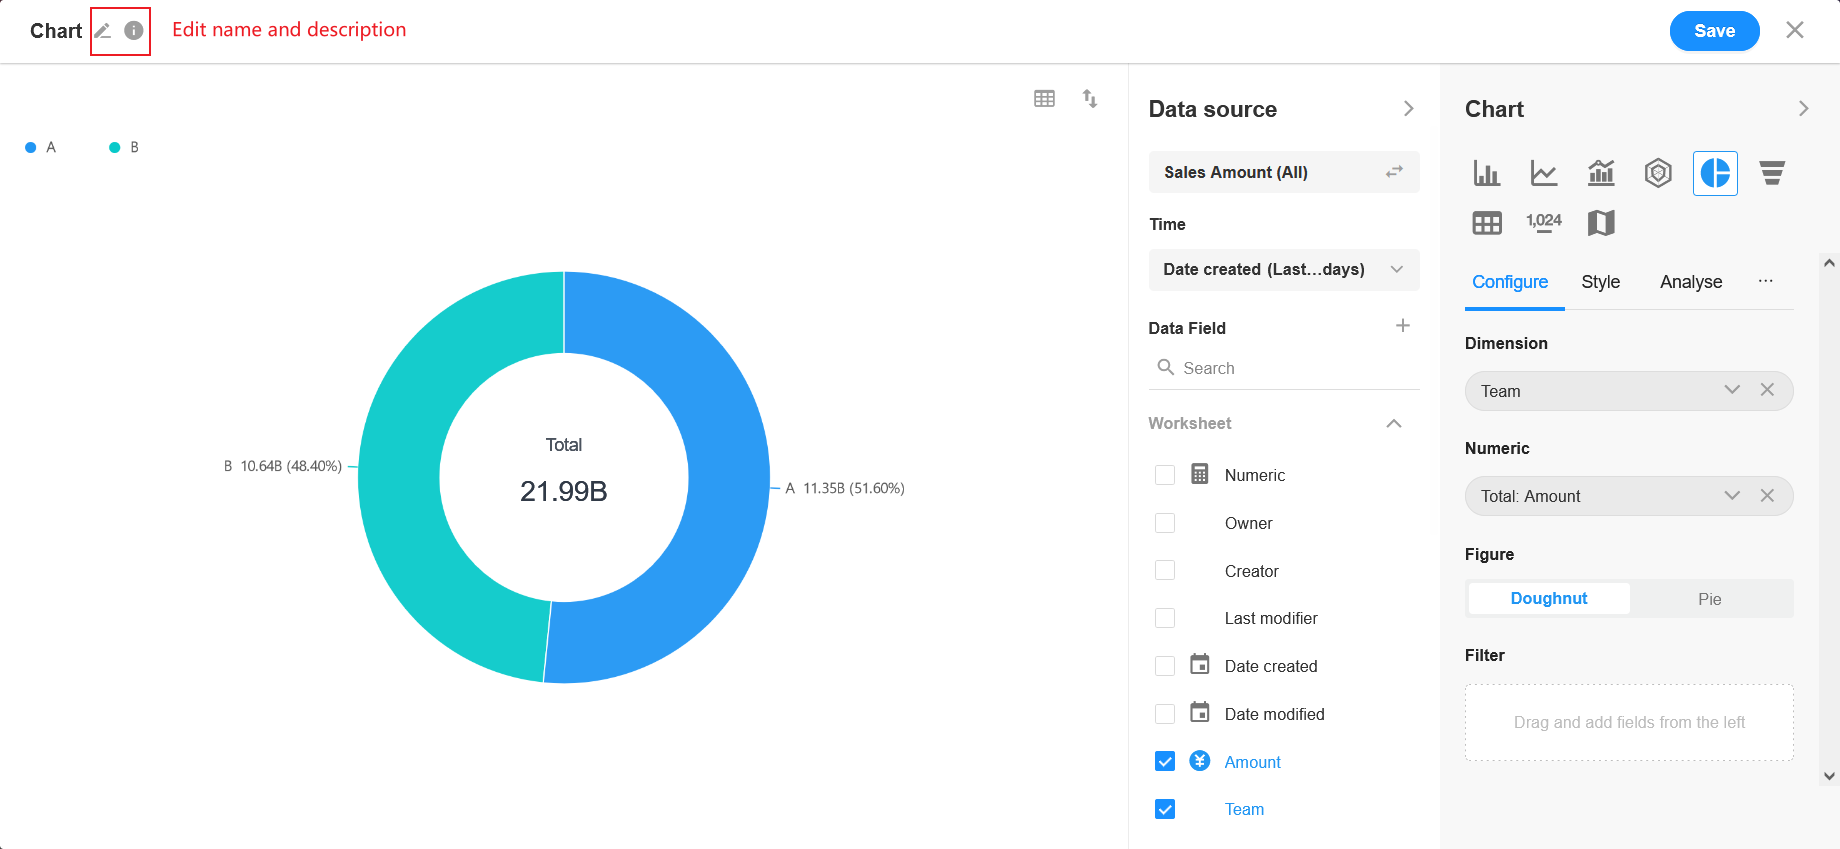
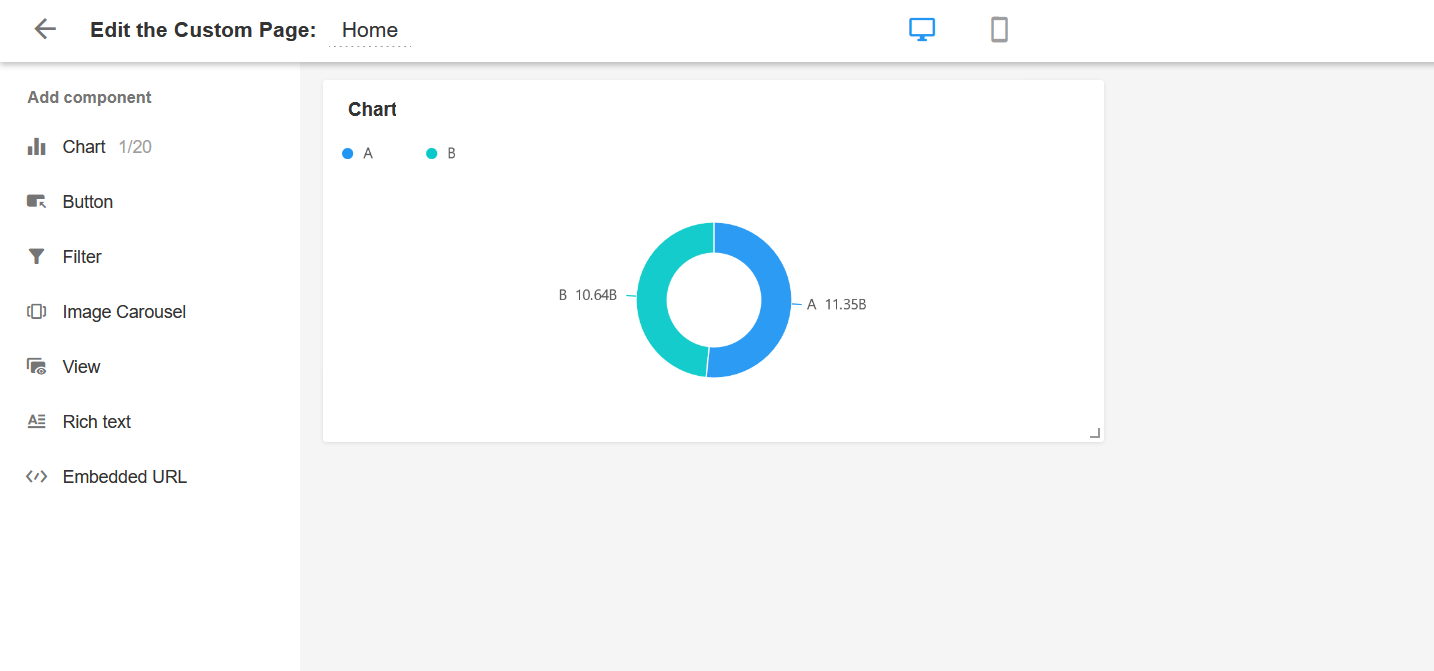
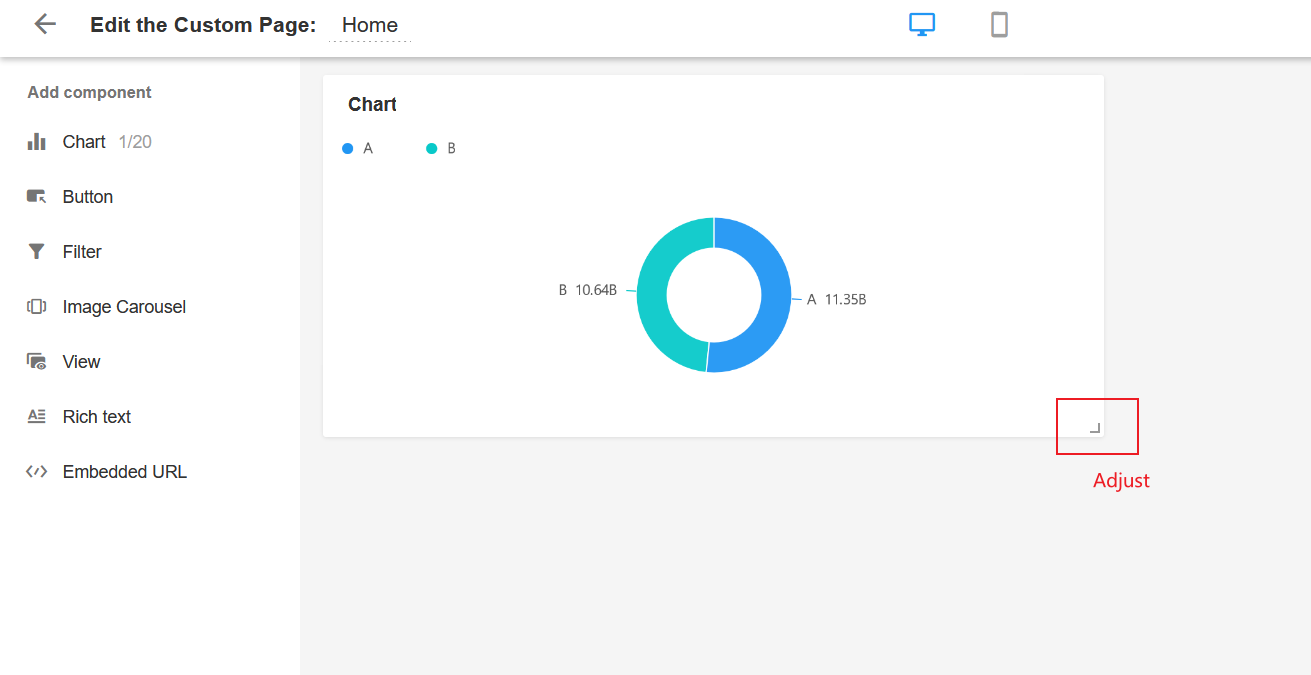
6. Resize the chart
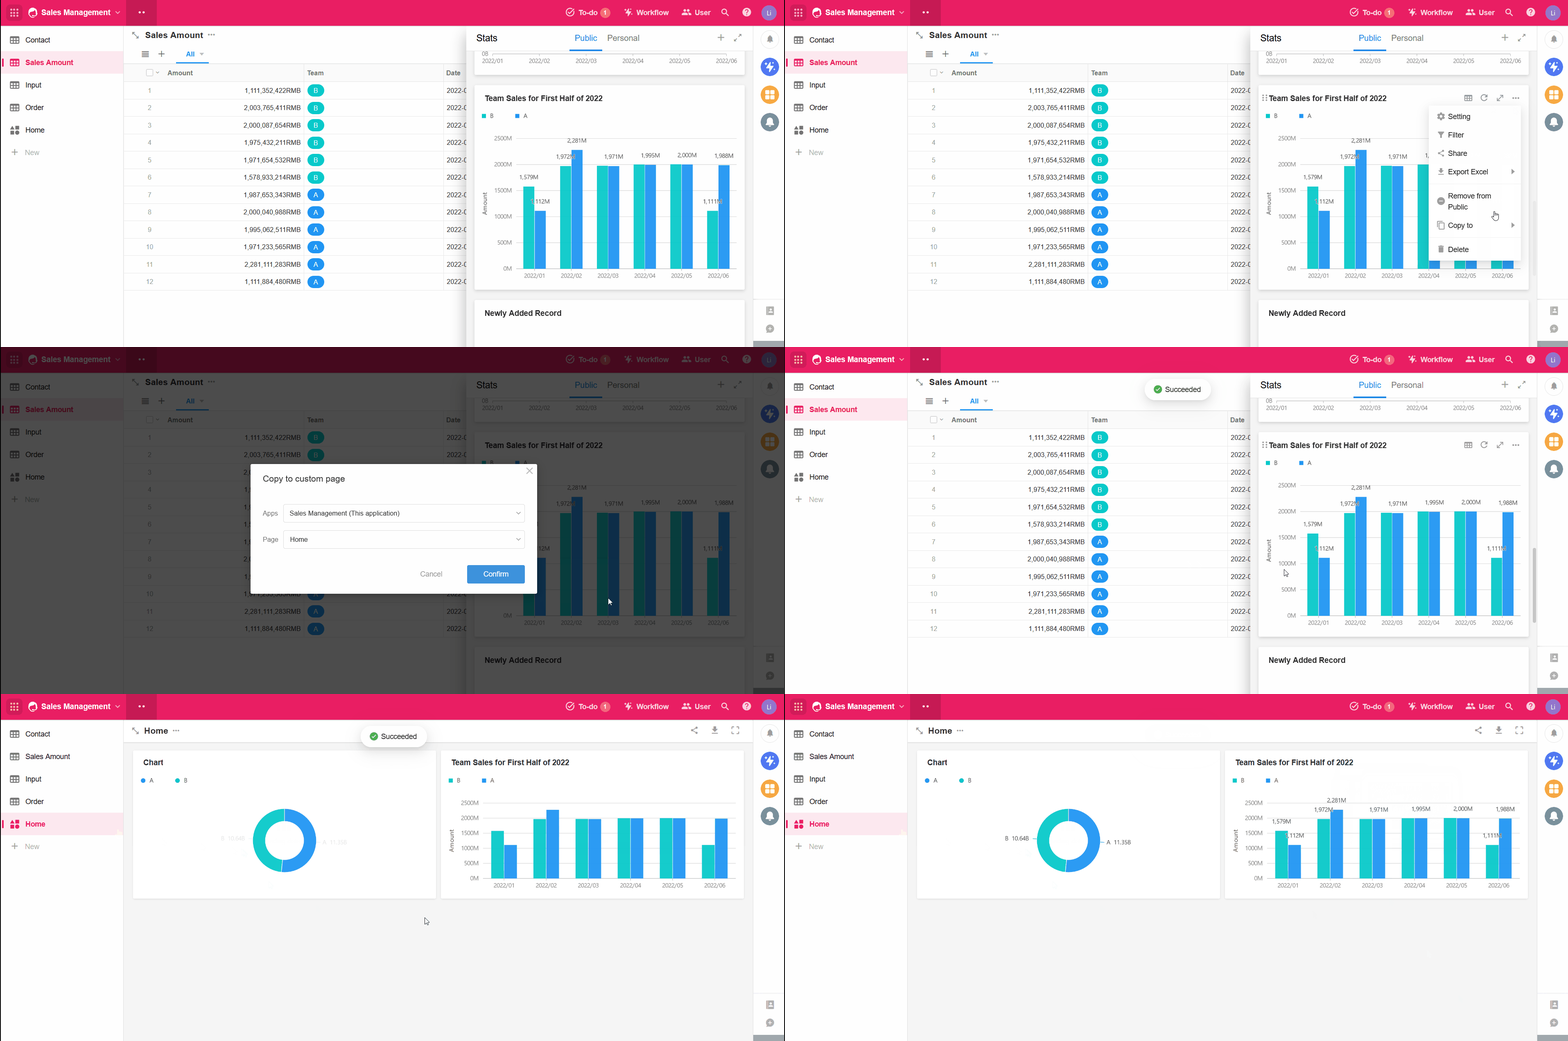
7. Copy existing charts to custom page
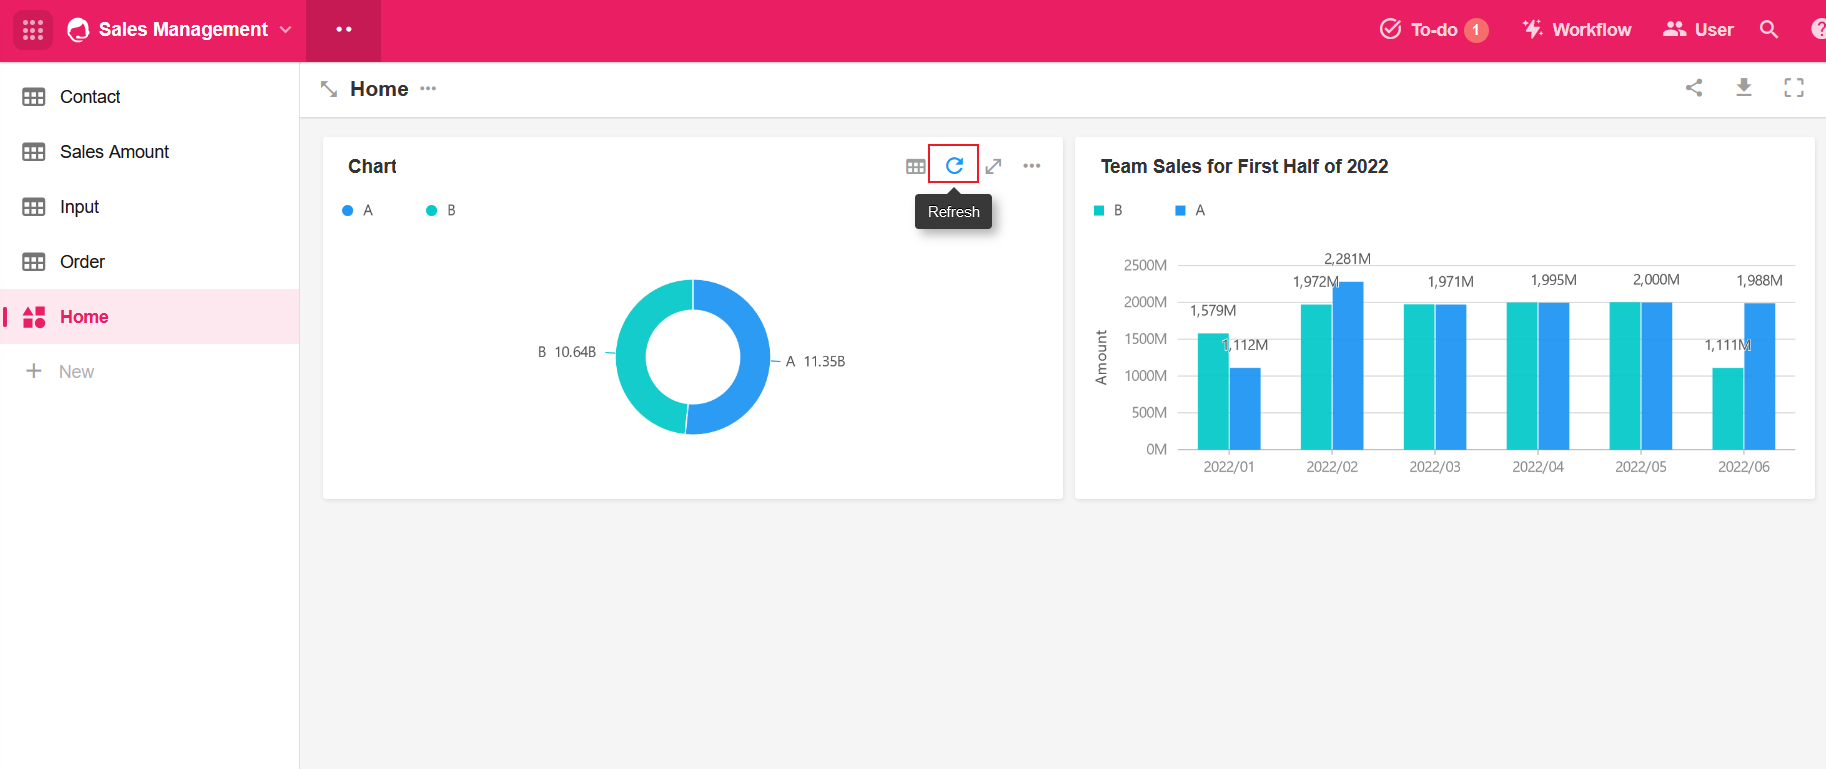
8. Refresh the chart
The charts are currently not showing real-time data and need to be refreshed manually.
Have questions about this article? Send us feedback